The boxplot in R is a very famous type of graph. Boxplot shows us how data is distributed in a dataset and divides the data into three quartiles. This graph is used to represent the first and third quartile, median, max, and min in a dataset. It also compares the distribution by making boxplots across the dataset.
The boxplot() function is used to create a boxplot in R.
Following is the syntax to create a boxplot:
Here:
- x is a vector
- data is the data frame
- notch is a logical value that is set as TRUE to draw a notch
- varwidth is a logical value that is set as true to draw width of the box
- names are the group labels
- main is used to give a title
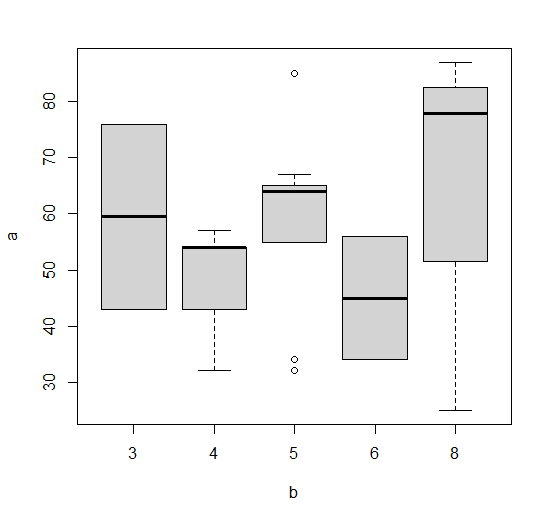
In the below example, we are going to create a data frame that we will use to create a boxplot.
Creating Boxplot in R
We will use the boxplot() function to create a boxplot in R.
df <- data.frame (
  a = c(34, 67, 87,64,32,54,64,32,76, 56, 34,57,85,25, 78,65,54,43,65,55,43),
  b = c(6, 5, 8,5,4,4,5,5,3, 6, 5,4,5,8, 8,5,4,4,5,5,3)
)
boxplot(a ~ b, data = df)
Output
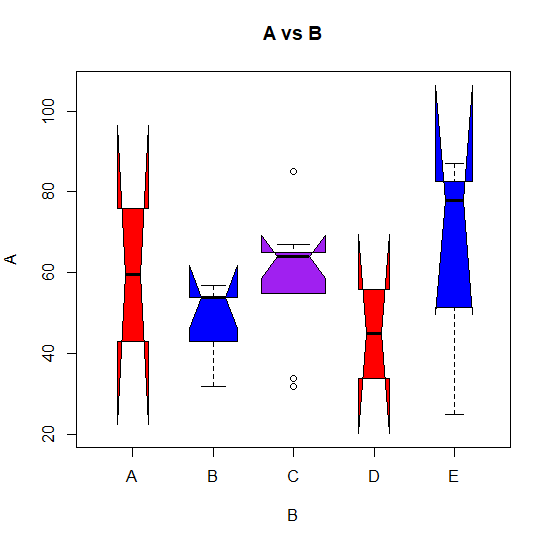
Boxplot with Notch
Using notch we can draw a boxplot to find out how the medians of different data groups match with each other.
df <- data.frame (
  a = c(34, 67, 87,64,32,54,64,32,76, 56, 34,57,85,25, 78,65,54,43,65,55,43),
  b = c(6, 5, 8,5,4,4,5,5,3, 6, 5,4,5,8, 8,5,4,4,5,5,3)
)
boxplot(a ~ b, data = df,
   xlab = "B",
   ylab = "A",
   main = "A vs B",
   notch = TRUE,
   varwidth = TRUE,
   col = c("red","blue","purple"),
   names = c("A","B","C",'D','E')
)
Output