For modeling events, the Poisson Regression in R is used where the outcomes are counts. The count data is discrete data with non-negative integer values that count things, such as the number of people in line at the grocery store.
The basic mathematical equation for Poisson regression in R is as follow:
Here:
- y is the response variable
- a and b are the numeric coefficients
- x is the predictor
To create the Poisson regression we used the glm() function in R. The basic syntax for the glm() function is as follow:
Here:
- formula represent the relationship between the variables.
- data is the dataset
- family is R object to specify the details of the model
We have created a dataset that describes the effect of A (Yes or No) and B (low, medium, or high) on the C which consists of some number. Let’s consider “C” as the response variable. The “A” and “B” are taken as predictor variables.
Creating Poisson Regression in R
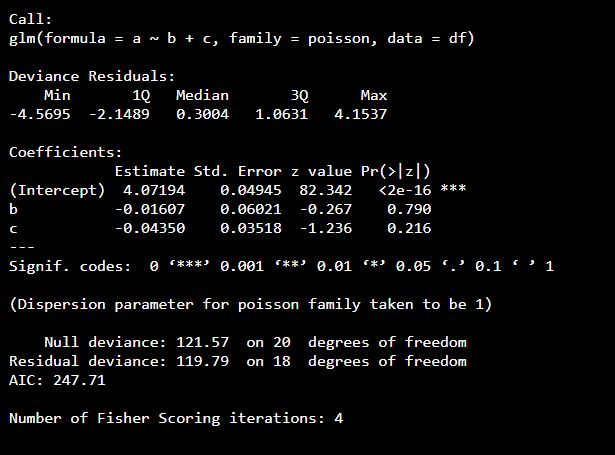
df <- data.frame (
  a = c(34, 67, 87,64,32,54,64,32,76, 56, 34,57,85,25, 78,65,54,43,65,55,43),
  b = c(1, 0, 0,0,0,1,0,0,1, 0,0,1,1,1, 0,0,1,0,1,0,1),
  c = c(2,0,2,1,1,1,0,0,2,2,2,2,0,1,0,2,1,0,0,1,2)
)
res <-glm(formula = a ~ b+c, data = df, family = poisson)
print(summary(res))
Output: