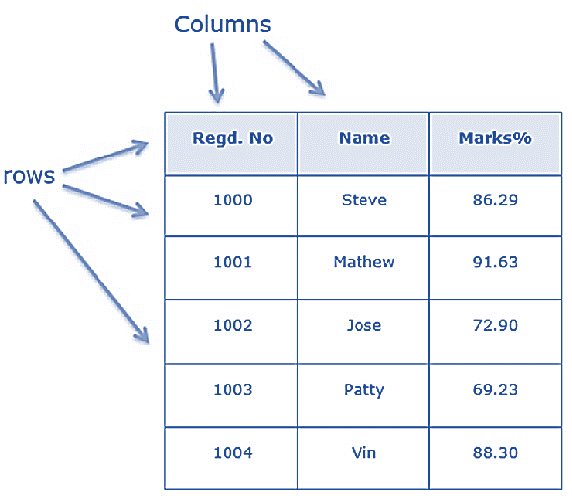
Data is displayed in the format of the table in the R data frame. There are different data types inside the R data frames. The character can be the first column, second and third can be numeric or logical. However, each column must have the same type of data.
Following are some R data frame characteristics:
- The column’s name must be non-empty
- The rows name must be different
- The data is stored in a data frame can be a factor, character or numeric type.
- Every column carry the same number of data items.
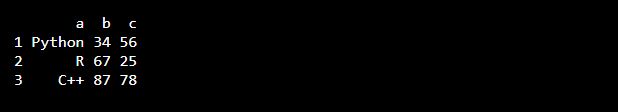
To create a data frame the data.frame() function is used.
df <- data.frame (
  a = c("Python", "R", "C++"),
  b = c(34, 67, 87),
  c = c(56, 25, 78)
)

df
Output
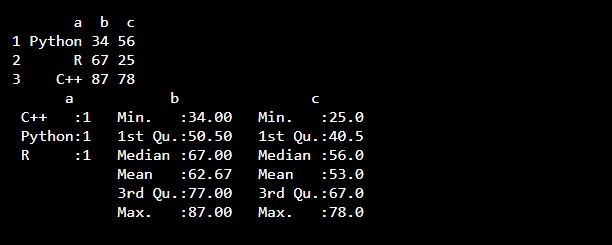
Summarize the Data
To summarize the data from a Data Frame we can use the summary() function:
df <- data.frame (
  a = c("Python", "R", "C++"),
  b = c(34, 67, 87),
  c = c(56, 25, 78)
)

df

summary(df)
Output
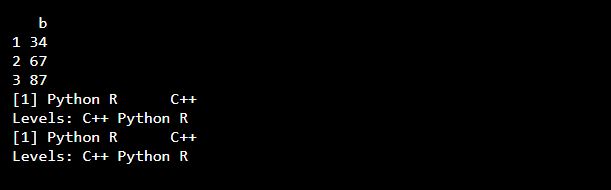
Access Items of R Data Frame
To access columns from a data frame we can use single brackets [ ], double brackets [[ ]] or $.
df <- data.frame (
  a = c("Python", "R", "C++"),
  b = c(34, 67, 87),
  c = c(56, 25, 78)
)

df[2]

df[["a"]]

df$a
Output
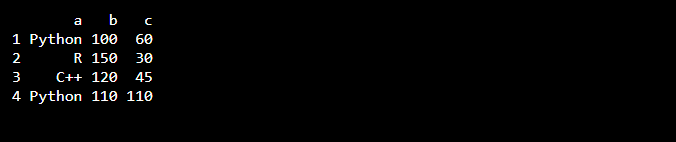
Add Rows
To add new rows in a Data Frame we can use the rbind() function:
df <- data.frame (
  a = c("Python", "R", "C++"),
  b = c(100, 150, 120),
  c = c(60, 30, 45)
)

dfr <- rbind(df, c("Python", 110, 110))

dfr
Output
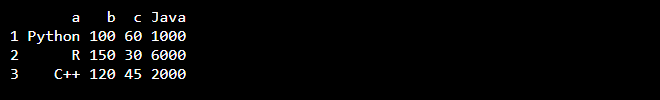
Add Columns
To add new columns in a Data Frame we can use the cbind() function:
df <- data.frame (
  a = c("Python", "R", "C++"),
  b = c(100, 150, 120),
  c = c(60, 30, 45)
)

dfc <- cbind(df, Java = c(1000, 6000, 2000))

dfc
Output
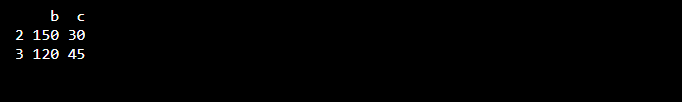
Remove Rows and Columns
To remove rows and columns in a Data Frame we can use the c() function:
df <- data.frame (
  a = c("Python", "R", "C++"),
  b = c(100, 150, 120),
  c = c(60, 30, 45)
)

dfn <- df[-c(1), -c(1)]

dfn
Output
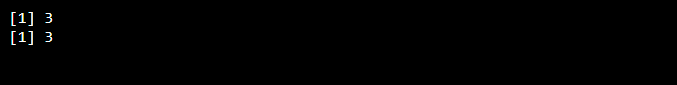
Amount of Rows and Columns
To find the amount of rows and columns in a Data Frame we can use the dim() function:
df <- data.frame (
  a = c("Python", "R", "C++"),
  b = c(100, 150, 120),
  c = c(60, 30, 45)
)

dim(df)
Output

To find the number of columns we can also use the ncol() function and to find the number of rows nrow() function can be used:
df <- data.frame (
  a = c("Python", "R", "C++"),
  b = c(100, 150, 120),
  c = c(60, 30, 45)
)


ncol(df)
nrow(df)
Output
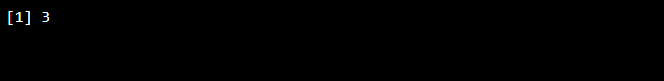
R Data Frame Length
To find the number of columns in a Data Frame we can use the length() function (similar to ncol()):
df <- data.frame (
  a = c("Python", "R", "C++"),
  b = c(100, 150, 120),
  c = c(60, 30, 45)
)

length(df)
Output
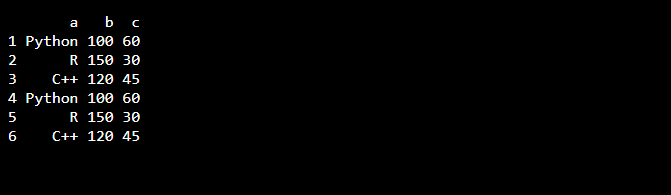
Combining Data Frames
To combine two or more data frames in R vertically we can use the rbind() function:
df1 <- data.frame (
  a = c("Python", "R", "C++"),
  b = c(100, 150, 120),
  c = c(60, 30, 45)
)

df2 <- data.frame (
  a = c("Python", "R", "C++"),
  b = c(100, 150, 120),
  c = c(60, 30, 45)
)

dfn <- rbind(df1, df2)
dfn
Output
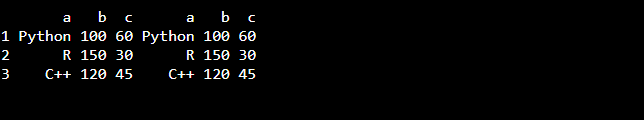
And to combine two or more data frames in R horizontally we can use the cbind() function.
df3 <- data.frame (
  a = c("Python", "R", "C++"),
  b = c(100, 150, 120),
  c = c(60, 30, 45)
)

df4 <- data.frame (
  a = c("Python", "R", "C++"),
  b = c(100, 150, 120),
  c = c(60, 30, 45)
)

dfnn <- cbind(df3, df4)
dfnn
Output