
The plot() function is used to plot numbers against each other. The scatter plot in R is used to show the relationship between two numerical variables.
Here we need two vectors of the same length, one for the x-axis (horizontal) and one for the y-axis (vertical):
x <- c(5,7,8,7,2,2,9,4,11,12,9,6)
y <- c(99,86,87,88,111,103,87,94,78,77,85,86)

plot(x, y)
Output
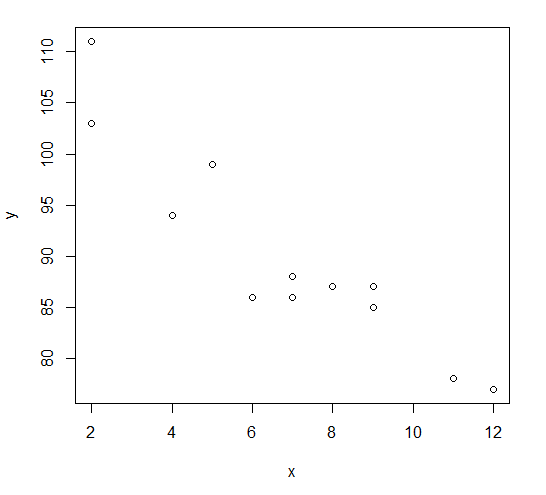
The above example shows the result of 12 values.
x <- c(5,7,8,7,2,2,9,4,11,12,9,6)
y <- c(99,86,87,88,111,103,87,94,78,77,85,86)

plot(x, y, main="X vs Y", xlab="X", ylab="Y")
Output
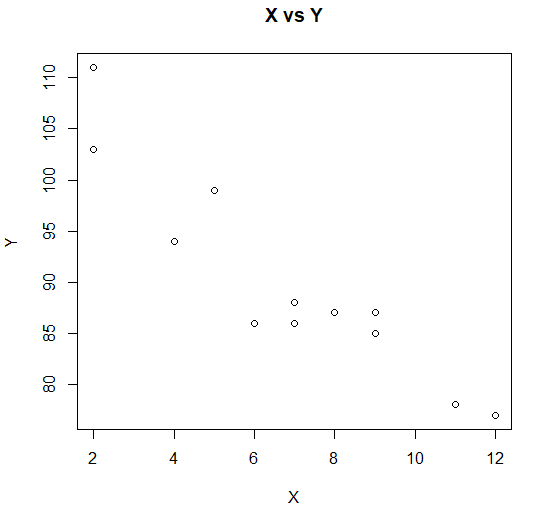
The above example shows the result of 12 values with title and labels.
Comparing Scatter Plot in R
According to the above examples, there seems to be a relationship between the two variables, but if we plot the observations from another variable as well?
Will the scatter plot tell us something else?
We can use the points() function to compare the plot with another plot:
# day one, the age and speed of 12 cars:
x1 <- c(5,7,8,7,2,2,9,4,11,12,9,6)
y1 <- c(99,86,87,88,111,103,87,94,78,77,85,86)

# day two, the age and speed of 15 cars:
x2 <- c(2,2,8,1,15,8,12,9,7,3,11,4,7,14,12)
y2 <- c(100,105,84,105,90,99,90,95,94,100,79,112,91,80,85)

plot(x1, y1, main="X vs Y", xlab="X", ylab="Y", col="green", cex=2)
points(x2, y2, col="red", cex=2)
Output
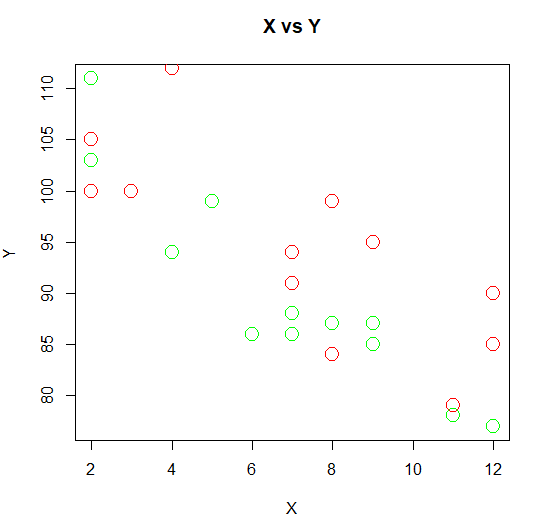
Note: To see the difference in the comparison, we can use different colors for the plots (by using the col parameter). green represents the values of plot 1, while red represents plot 2. Here the cex parameter is used to increase the size of the dots.