The time series in R is a series of data points in which each data point is linked with a timestamp. The best example of time series in R is the price of a stock in the stock market at different points of time on a given day. The amount of rainfall in a region at different months of the year is also an example of time series.
In R programming many functions are used to create, manipulate, and plot the time series data. The data for the time series is stored in an R object called a time series object.
The ts() function is used to create the time series object. The generic syntax for ts() function in time series analysis is
Have a look at below a description of the parameters used
- data: a matrix or vector containing the time series values used in the
- start: the start time for the first observation
- end: the end time for the last observation
- frequency: the number of observations per unit time.
All other parameters are optional except the data parameter.
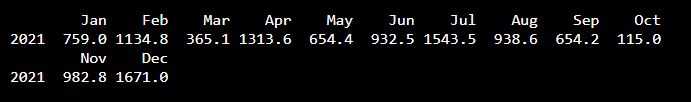
# Get the data
rain <- c(759,1134.8,365.1,1313.6,654.4,932.5,1543.5,938.6,654.2,115,982.8,1671)

# Convert it to a time series
rain.timeseries <- ts(rain,start = c(2021,1),frequency = 12)

# Print the timeseries
print(rain.timeseries)
Output:
Different Time Intervals
The value of the frequency parameter in ts() function decides the time intervals at which the data points are measured.
- frequency = 12 pegs the data points for every month of a year.
- frequency = 4 pegs the data points for every quarter of a year.
- frequency = 6 pegs the data points for every 10 minutes of an hour.
- frequency = 24*6 pegs the data points for every 10 minutes of a day.
Multiple Time Series in R
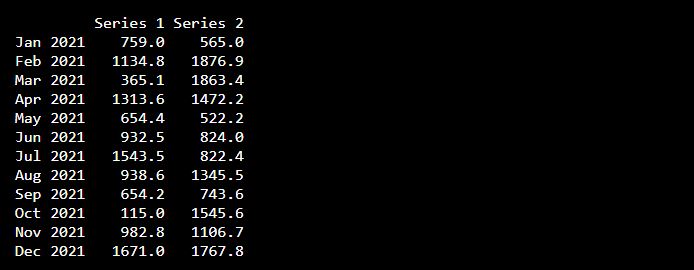
You can plot several time series in one chart by combining both series into the matrix.
rain1 <- c(759,1134.8,365.1,1313.6,654.4,932.5,1543.5,938.6,654.2,115,982.8,1671)
rain2 <- c(565,1876.9,1863.4,1472.2,522.2,824,822.4,1345.5,743.6,1545.6,1106.7,1767.8)

# Convert to matrix.
rain <-  matrix(c(rain1,rain2),nrow = 12)

# Convert it to a time series
timeseries <- ts(rain,start = c(2021,1),frequency = 12)

# Print the timeseries
print(timeseries)
Output