For Statistical Analysis in R programming, several built-in functions are available like mean, mode, median. These functions are part of the R programming base package. These functions take R vectors as an input along with the arguments and give the result.
Mean
For Statistical Analysis in R, the mean is calculated by taking the sum of the values and divide it with the number of values in the dataset. The mean() function is used to calculate it in R programming.
Its syntax is given below:
Here:
- x is the input vector.
- trim is used to drop some observations
- na.rm is used to remove the missing values
m <- c(12,78,34,4.32,18,2,24,21,8,25)

res <- mean(m)
print(res)
Output

Applying Trim Option
The trim parameter is supplied the values in the vector to get sorted and then the required numbers of observations are dropped from calculating it.
Trim=0.2, 2 values from each end will be dropped from the calculations.
m <- c(12,78,34,4.32,18,2,24,21,8,25)

res <-  mean(m,trim = 0.2)
print(res)
Output

Applying NA Option
The above function returns NA in case of missing values. To drop the missing values from the calculation use na.rm=TRUE which means remove the NA values.
m <- c(12,78,34,4.32,18,2,24,21,8,25,NA)

res <-  mean(m)
print(res)

res <-  mean(m,na.rm = TRUE)
print(res)
Output
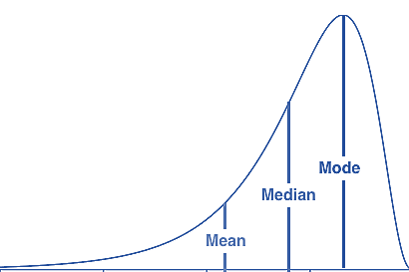
Median
For Statistical Analysis in R, the median() function is used to calculate the median. The most center value in a data series is called the median.
Check the below syntax for calculating median in R programming:
Here:
- m is the input vector.
- na.rm is used to remove the missing values
m <- c(12,78,34,4.32,18,2,24,21,8,25)

res <- median(m)
print(res)
Output

Mode
The highest number of occurrences in a set of data is known as mode. The mode can have both numeric and character data unlike mean and median.
For Statistical Analysis in R there is not a standard in-built function to calculate the mode. That’s why we create a user function to calculate the mode of a data set in R programming. The major function is to takes the vector as input and gives the mode value as output.
getmode <- function(v) {
   uniqv <- unique(v)
   uniqv[which.max(tabulate(match(v, uniqv)))]
}

# Numeric mode
v <- c(12,78,34,4.32,18,12,24,21,8,25)

res <- getmode(v)
print(res)

# character mode
charv <- c("she","the","the","it","he")

# Calculate the mode using the user function.
res<- getmode(charv)
print(res)
Output
Min and Max
The Min and max in R can be used to find the lowest or highest value in a set. Its syntax is given below:
An example for calculation min and max is given below:
x <-c(12,78,34,4.32,18,12,24,21,8,25)

max(x)
min(x)
Output
The example for calculating min and max without NA
x <-c(12,78,34,4.32,18,12,24,21,8,25,NA)

max(x, na.rm=TRUE)
min(x, na.rm=TRUE)
Output