Linear Regression in R predicts the output of the y variable based on one or more input x variables. In simple words, it is used to establish a relationship between output and input variables. The input and output variables are related through an equation in which the exponent of both these variables is 1.
A linear regression mathematically denotes a straight line when plotted. The equation for linear regression is as follow:
Here,
- y is a response variable.
- x is a predictor variable.
- a and b are constants that are called the coefficients.
Process for Establishing a Regression
The best example is a prediction of weight using the height of a person in Regression. For this purpose, we need the relationship between weight and height. To create a relationship we need to follow the below-mentioned steps:
- Collect height and weight values to for experiment sample.
- Using the lm() function in R create a relationship model.
- Create the mathematical equations from the model created coefficient values.
- Get a relationship model summary to know the average error in prediction also known as residual.
- Use the predict() function in R to predict the new weight
lm() Function for linear regression in R
The lm() function is used to create a relationship between the response variable and predictor.
The syntax for lm() function is given below:
Here:
- formula represent the relation between x and .
- data is the vector
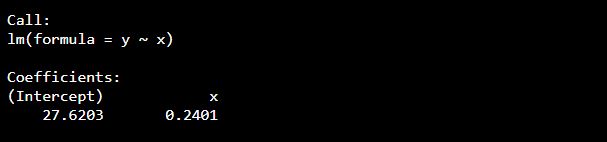
Create Relationship Model & get the Coefficients
x <- c(161, 174, 132, 126, 128, 132, 171, 133, 112, 121, 175, 145, 156)
y <- c(61, 79, 51, 88, 43, 52, 72, 78, 59, 46, 71, 51, 56)

# Apply the lm()
lr <- lm(y~x)

print(lr)
Output:
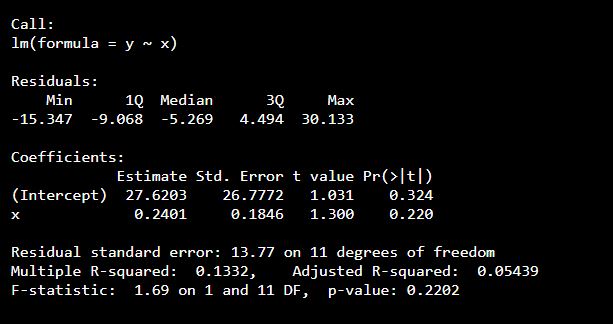
Get the Summary of the Relationship
x <- c(161, 174, 132, 126, 128, 132, 171, 133, 112, 121, 175, 145, 156)
y <- c(61, 79, 51, 88, 43, 52, 72, 78, 59, 46, 71, 51, 56)

# Apply the lm()
lr <- lm(y~x)

print(summary(lr))
Output:
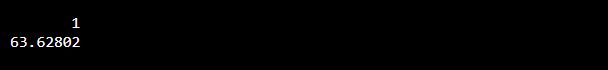
Predict() Function for Linear Regression in R
The predict function is used to predict the new outcome using the input variable. The syntax for predict() function is given below:
Following is the description of the parameters used −
- object is the formula created using the lm() function
- newdata is the vector
x <- c(161, 174, 132, 126, 128, 132, 171, 133, 112, 121, 175, 145, 156)
y <- c(61, 79, 51, 88, 43, 52, 72, 78, 59, 46, 71, 51, 56)

lr <- lm(y~x)

# Find new weight
df <- data.frame(x = 150)
r <-  predict(lr,df)
print(r)
Output:
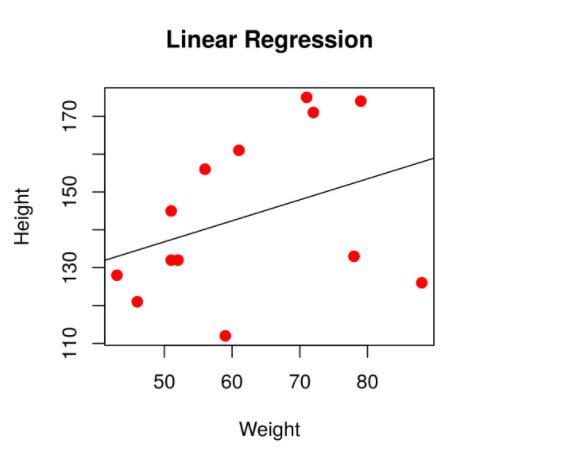
Plotting the Linear Regression in R
x <- c(161, 174, 132, 126, 128, 132, 171, 133, 112, 121, 175, 145, 156)
y <- c(61, 79, 51, 88, 43, 52, 72, 78, 59, 46, 71, 51, 56)

plot(y,x,col = "red",main = "Linear Regression",
abline(lm(x~y)),cex = 1.2,pch = 13,xlab = "Weight",ylab = "Height")
Output: