
The data reshaping in R is the name of changing the data organized in rows and columns. Data processing is done by taking the input as a data frame. It is the easiest method to extract data from the rows and columns of the data frame, but here is a problem when you want a data frame in a format that is different from the format in which received it.
Functions of Data Reshaping in R
There are several functions to merge, Split and change the rows to columns and columns and rows in a data frame for data reshaping in R programming. These are given below:
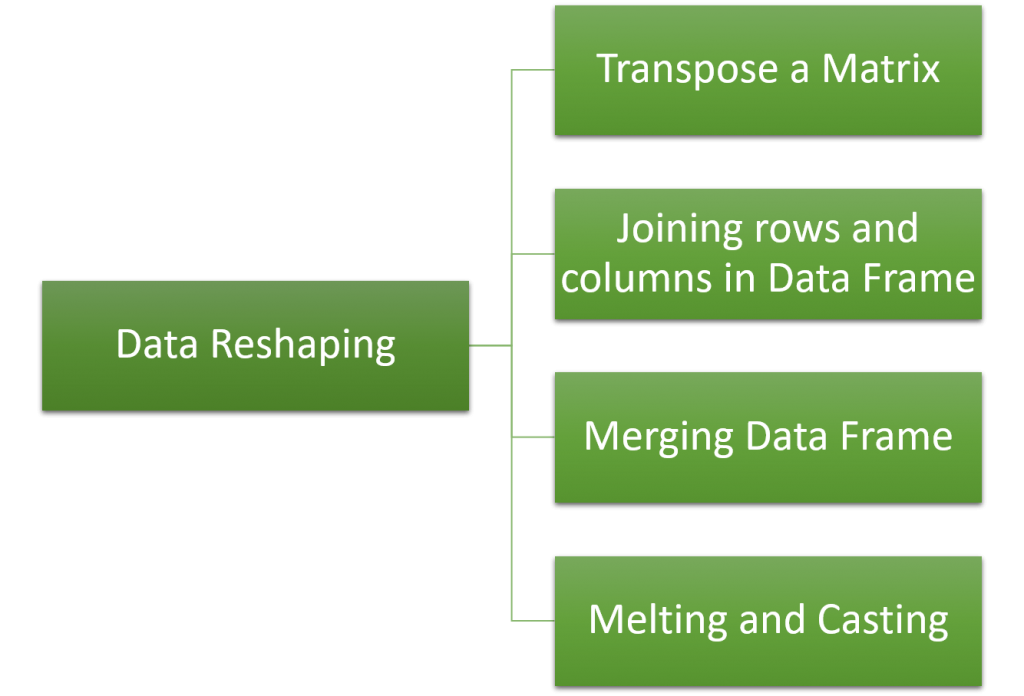
Transpose a Matrix
The first function for data reshaping in R is to transpose a matrix. To calculate the transpose of a matrix or a data frame the t() function is used. The t() function takes the matrix or data frame as an input and returns the transpose of the input matrix or data frame.
The t() function syntax is mentioned below:
Let’s understand the working of this function with an example:
a <- matrix(c(4:12),nrow=3,byrow=TRUE)
a
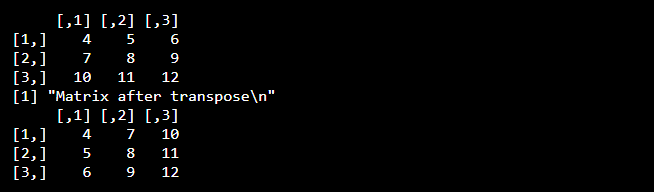
print("Matrix after transpose\n")
b <- t(a)
b
Output
Joining rows and columns in Data Frame
In R programming you can join multiple vectors to create a data frame. R programming provides cbind() function for this purpose. It also provides the rbind() function used for the same purpose. In some cases, you need to merge data frames to access the information which depends on both the data frame.
Check the following syntax of cbind() function and rbind() function:
Let’s understand the working of cbind() and rbind() function with an example:
#Creating vector objects
Name <- c("Ali","Ahmad","Nida","Farwa")
Address <- c("Lhr","Karachi","ISL","Kohat")
Marks <- c(255,355,455,655)
#Combining vectors into one data frame
i <- cbind(Name,Address,Marks)
#Printing data frame
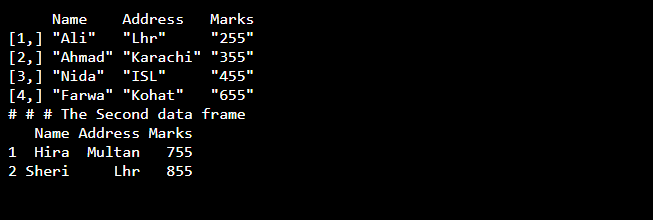
print(i)
# Creating another data frame with similar columns
new.stuinfo <- data.frame(
Name = c("Hira","Sheri"),
Address = c("Multan","Lhr"),
Marks = c("755","855"),
stringsAsFactors=FALSE
)
#Printing a header.
cat("# # # The Second data frame\n")
#Printing the data frame.
print(new.stuinfo)
# Combining rows form both the data frames.
all.info <- rbind(i,new.stuinfo)
# Printing a header.
cat("# # # The combined data frame\n")
# Printing the result.
print(all.info)
Output
Merging Data Frame
The merge() function is used to merge two data frames. In the merging process, there is a compulsion that data frames must have the same column names
Let’s understand it with an example:
library(MASS)
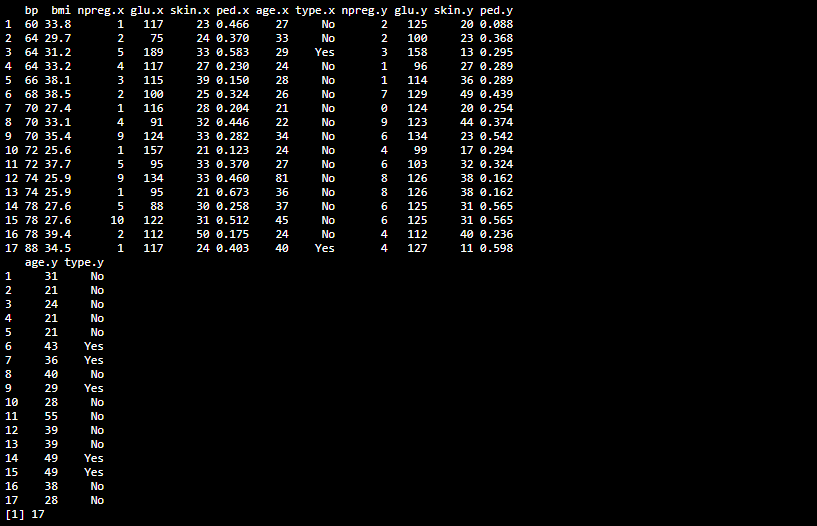
p<- merge(x = Pima.te, y = Pima.tr,
by.x = c("bp", "bmi"),
by.y = c("bp", "bmi")
)
print(p)
nrow(p)
Output
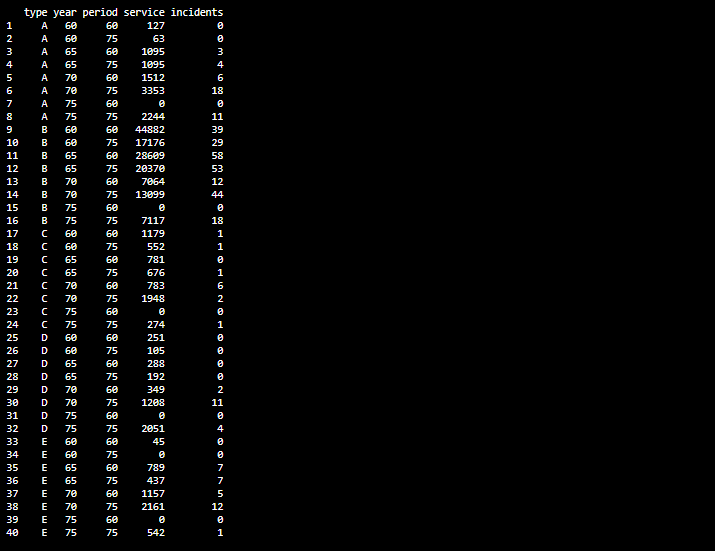
Melting and Casting
In R programming, melt() and cast() functions are used for melting and casting. Basically, melting is the process of converting the columns into multiple rows. We will convert all columns except the type and year of the above dataset into multiple rows. After melting the data, you can cast it into a new form. R programming provides cast() function for this purpose.
library(MASS)
library(reshape)
Output
The process of melting and casting is done as follow on above data: