The pie chart is a circular graphical representation of data. You can draw a pie chart in R with help of the pie() function.
# Create a vector of pies
x <- c(34,65,54,58,32)

# Display the pie chart
pie(x)
Output
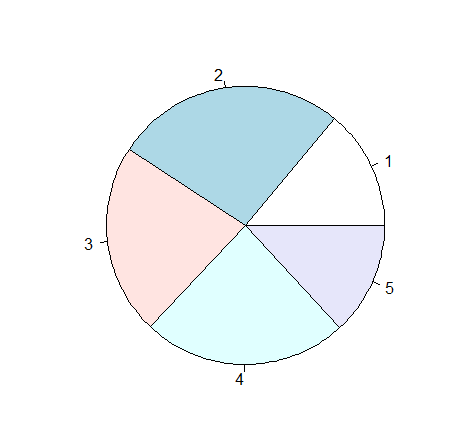
The above pie chart draws one pie for each value (34,65,54,58,32) in the vector.
The plotting of the first pie starts from the x-axis and move counterclockwise by default.
Note: The size of each pie is determined using this formula:
Start Angle of Pie Chart in R
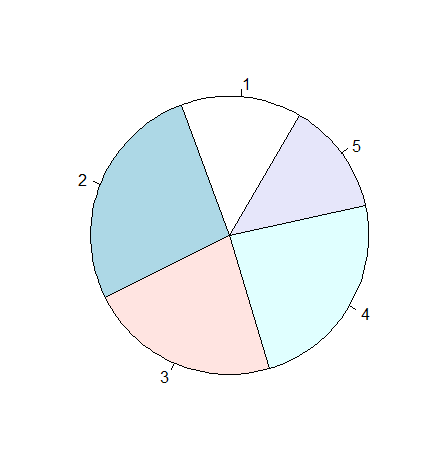
The start angle of the pie chart in R can be changed with the help of init.angle parameter. The value of init.angle is defined with the angle in degrees, While 0 is the default angle.
# Create a vector of pies
x <- c(34,65,54,58,32)

# Display the first pie at 90 degrees
pie(x, init.angle = 60)
Output
Labels and Header
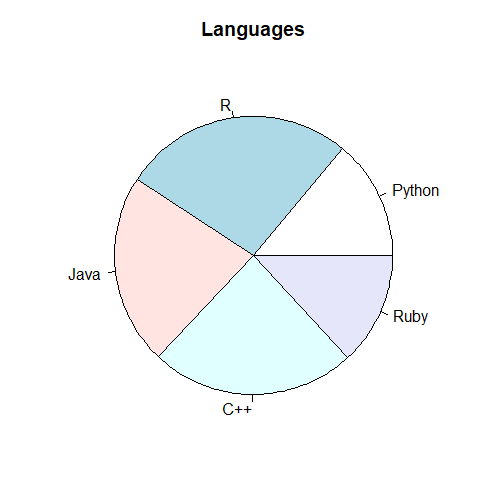
The label parameter is used to add a label to the pie chart in R, and the main parameter is used to add a header.
# Create a vector of pies
x <- c(34,65,54,58,32)

# Create a vector of labels
lab <- c("Python", "R", "Java", "C++", "Ruby")

# Display the pie chart with labels
pie(x, label = lab, main = "Languages")
Output
Colors
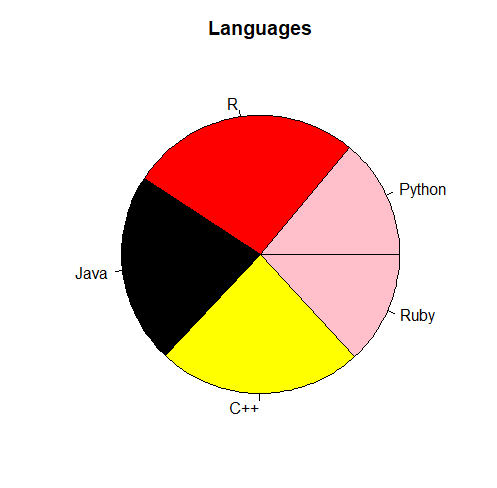
We can add a color to each pie with the col parameter.
# Create a vector of pies
x <- c(34,65,54,58,32)

# Create a vector of labels
lab <- c("Python", "R", "Java", "C++", "Ruby")
# Create a vector of colors
c <- c("pink", "red", "black", "yellow")

# Display the pie chart with colors
pie(x, label = lab, main = "Languages", col = c)
Output
Legend
The legend() function is used to add a list of explanations for each pie.
# Create a vector of pies
x <- c(34,65,54,58,32)

# Create a vector of labels
lab <- c("Python", "R", "Java", "C++", "Ruby")
# Create a vector of colors
c <- c("pink", "red", "black", "yellow")

# Display the pie chart with colors
pie(x, label = lab, main = "Pie Chart", col = c)

# Display the explanation box
legend("top", lab, fill = c)
Output
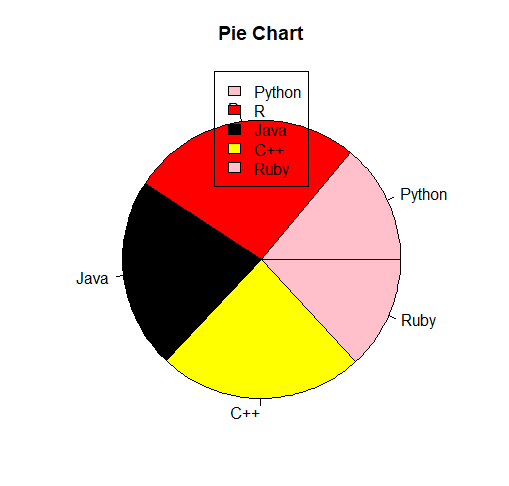
We can set the legend as:
bottomright, bottom, bottomleft, left, topleft, top, topright, right, center
